Anomaly Detection on PLC Data with Python: A Practical Walkthrough for Automation Engineers

The question worth answering
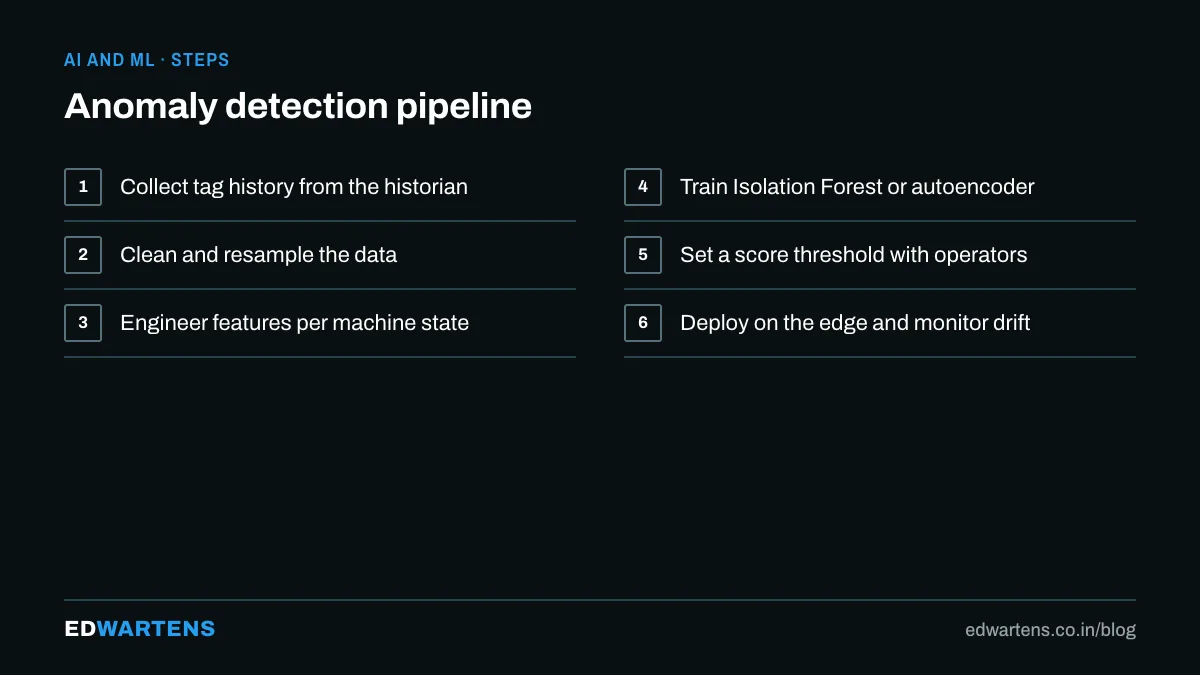
Machine learning in a plant does not start with a neural network. It starts with a compressor that trips every few weeks and a maintenance manager asking whether the data could have warned him. Usually it could. Motor current creeps up, discharge temperature drifts, vibration changes character, days before the trip. Anomaly detection is the family of methods that finds "this does not look like normal" without needing labelled examples of failure, which is why it is the right first project.
Get the data out
The historian or a time-series database is the source. Export a CSV with a timestamp and the tags that describe the machine: motor current, discharge pressure and temperature, suction pressure, bearing temperature, running state. A month at ten-second resolution for one compressor is about 260,000 rows, which a laptop handles easily.
import pandas as pd
df = pd.read_csv("compressor.csv", parse_dates=["ts"]).set_index("ts")
df = df[df["running"] == 1]          # only when it runs
df = df.resample("1min").mean()      # calm the noise
Start with statistics, not models
Rolling statistics catch most of it and everybody can understand them:
win = "6h"
z = (df - df.rolling(win).mean()) / df.rolling(win).std()
flags = (z.abs() > 3).any(axis=1)
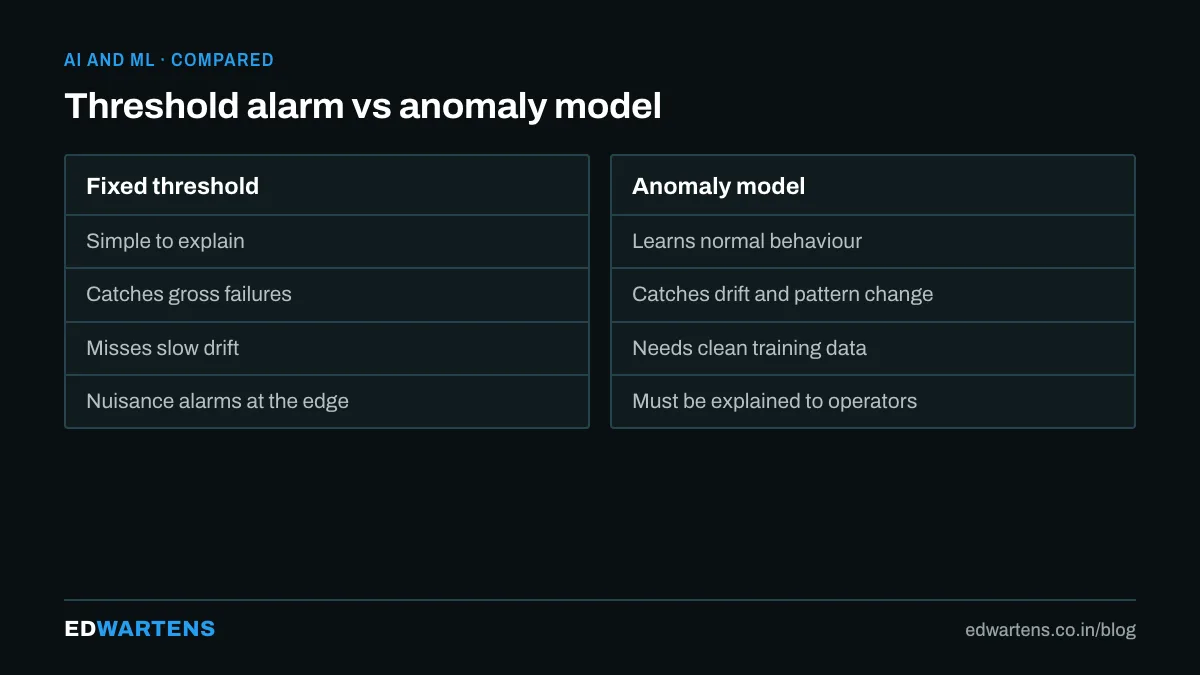
A point three standard deviations from the last six hours of behaviour is worth a look. Plot the flags on the trend and you will find the drift before the trip on the first attempt.
Isolation forest for multivariate anomalies
Single-tag limits miss the failures where every tag is inside its limit but the combination is wrong: normal current at abnormally low pressure. An isolation forest scores how easy each point is to separate from the rest; anomalies isolate in few splits.
from sklearn.ensemble import IsolationForest
X = df[["current", "disch_press", "disch_temp", "suct_press", "bearing_temp"]].dropna()
model = IsolationForest(contamination=0.01, random_state=0).fit(X)
X["score"] = model.decision_function(X)
X["anomaly"] = model.predict(X) == -1
Train on a period you know was healthy, then score new data daily. The contamination parameter is the share of points you expect to be abnormal; start at one percent and tune by looking at what it flags.
Make it useful
- Persistence: one anomalous minute is noise; thirty in an hour is a warning. Count flags in a window.
- Explain it: report which tags contributed. The maintenance team acts on "discharge temperature high for the pressure", not on a score.
- Deploy beside the SCADA: a Python script on a schedule, reading the database and writing a health score back to an MQTT topic or an OPC UA tag that the SCADA alarms on. Node-RED can run the schedule and the dashboard.
What the model cannot do
It cannot tell you why. It flags departures from normal, and normal includes every bad habit the machine already has. A process change (new product, new season) will look anomalous until the model is retrained. Treat it as a very attentive junior engineer: it points, you diagnose.
Learning path
Python basics for engineers are in Python for automation engineers; the control-systems view of the data is in the MATLAB and Simulink course; the full predictive maintenance picture is in predictive maintenance using machine learning.
Frequently asked questions
Do I need a GPU? No. Isolation forests on a few hundred thousand rows train in seconds on a laptop.
What if we have no historian? Log from the PLC with Node-RED into a free time-series database for a month, then start.
Is this predictive maintenance? It is the first half. Predicting remaining life needs failure history; detecting that something has changed needs only normal history, which every plant has.
Learn this, free
The courses that teach this
Every lesson, the written notes and the practice are free with an account. Only the certificate is optional and paid.


