From PLC to Cloud Dashboard: Building a Complete Data Pipeline with OPC UA, MQTT, Node-RED and a Time-Series Database

The project every automation engineer should build once
Nothing teaches IIoT like wiring the whole chain yourself: PLC, protocol, broker, database, dashboard. It takes a weekend with free software, and afterwards every vendor's platform is recognisable as the same chain with a logo. This is the build.
The stack
Layer | Tool | Cost |
|---|---|---|
PLC | S7-1200 or PLCSIM Advanced, or any PLC with OPC UA | free simulator |
Edge logic | Node-RED | free |
Messaging | Mosquitto MQTT broker | free |
Storage | InfluxDB or TimescaleDB | free |
Dashboard | Grafana, or Node-RED Dashboard | free |
All of it runs on one laptop or a Raspberry Pi; in production the same pieces run on an industrial PC and a server.
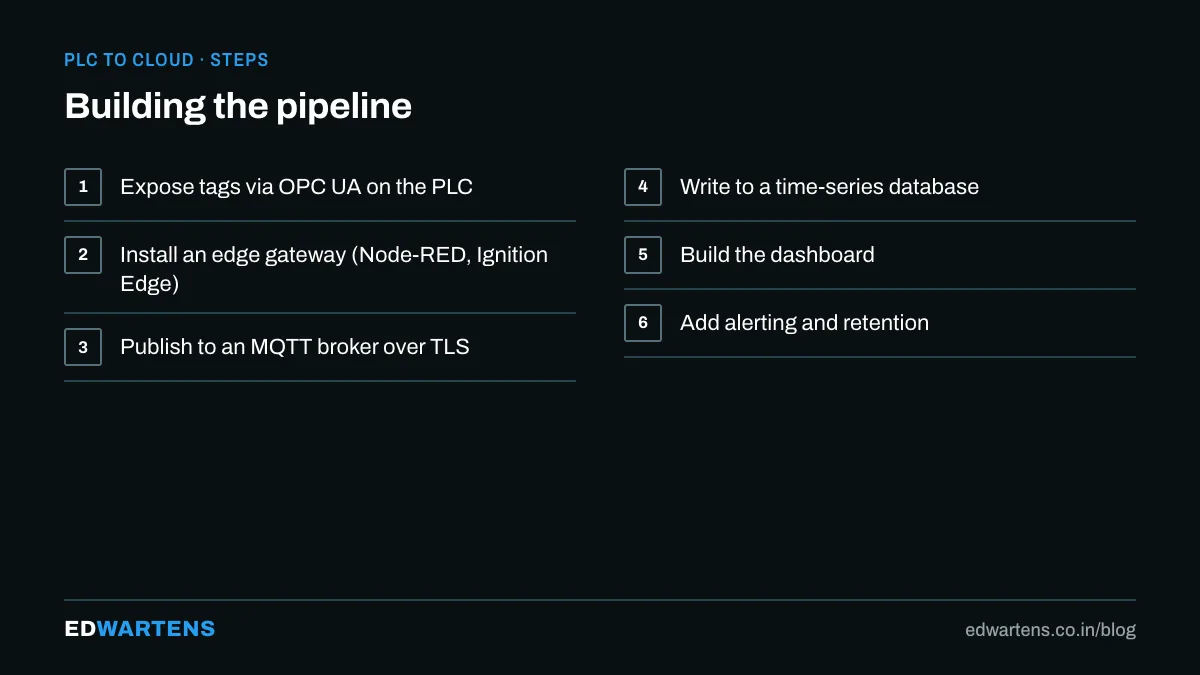
Step 1: expose the tags
Enable the OPC UA server on the PLC and mark the tags accessible: line speed, product count, motor current, machine state. In PLCSIM Advanced the server runs on the simulator. Test with UaExpert: if you can browse it there, Node-RED can read it.
Step 2: read with Node-RED
Install Node-RED, add the OPC UA client nodes, and build a flow: an OPC UA subscription node feeding a function node that builds a JSON object with tag name, value, timestamp and quality. The Node-RED IIoT course covers the nodes, the credentials and the security policies.
Step 3: publish with MQTT
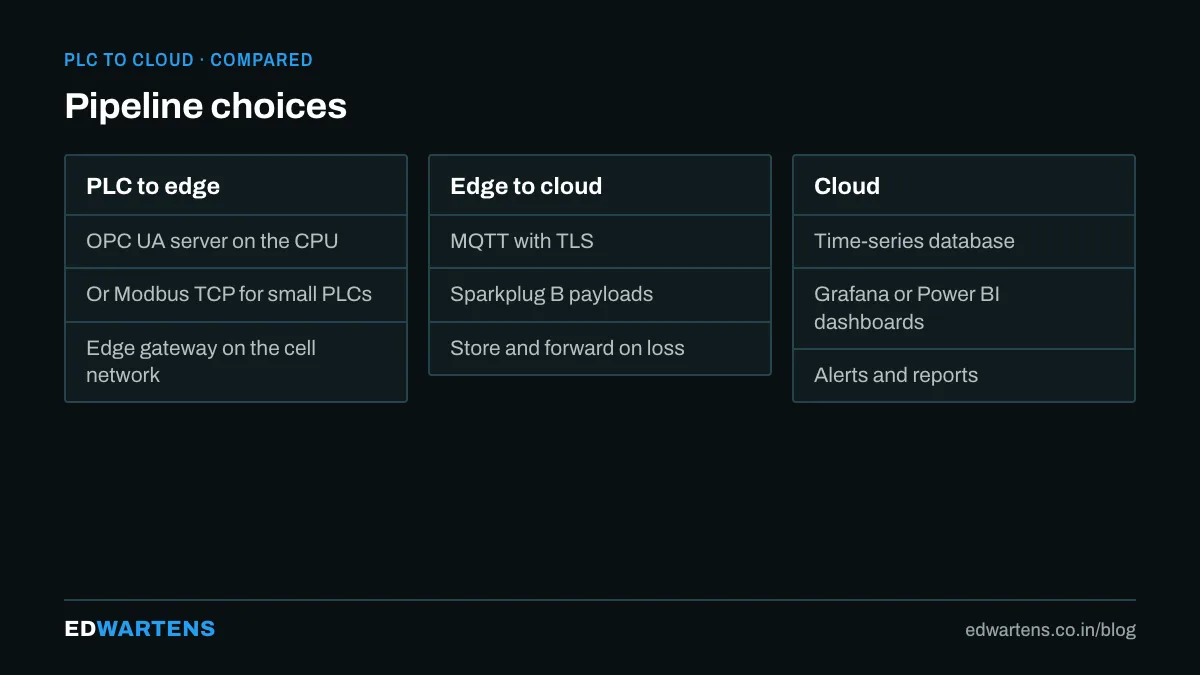
Add an MQTT out node pointing at Mosquitto. Topic: plant/line1/filler/speed. For a real plant, publish Sparkplug B instead of raw JSON so every consumer understands the metrics; for the first build, JSON is fine.
Step 4: store
Subscribe with a second flow (or with Telegraf) and write into InfluxDB, one measurement per machine with tags for line and machine and fields for the values. Retention policy: raw for 90 days, downsampled averages for years.
Step 5: show
Point Grafana at the database. Build one dashboard: line speed as a time series, product count per hour as a bar chart, machine state as a state timeline, current with a threshold line. Add an alert rule that emails when the current is high for ten minutes. You now have a monitoring system many plants pay lakhs for.
Hardening it for a plant
- TLS and credentials on OPC UA and MQTT, as in SCADA cybersecurity basics.
- The edge PC in the control zone, the broker in the DMZ, the database and dashboard above it.
- Store-and-forward on the edge, so a network outage does not lose data.
- A clock synchronised everywhere, or the timestamps will lie.
From here
Add the anomaly detection script reading the database and publishing a health score; add a digital twin fed by the same stream. The pipeline is the foundation for both.
Frequently asked questions
Can I do this with an Allen-Bradley PLC? Yes, with the Node-RED EtherNet/IP nodes or a gateway; the rest of the chain is identical.
Should I use a cloud database instead? For learning, no. For a plant, only after the local pipeline works, and then the cloud is a second subscriber to the same broker.
How long does this take? A weekend with the simulator. The free course walks through it in order.
Learn this, free
The courses that teach this
Every lesson, the written notes and the practice are free with an account. Only the certificate is optional and paid.


