Data and analytics · Free online course
Power BI for Manufacturing: OEE and Production Dashboards
The no-code way out of the weekly Excel production report. Twelve modules take an engineer from opening Power BI Desktop for the first time to a shift-wise OEE dashboard: Power Query on downtime and production exports, a star schema a plant model can live in, the DAX behind availability, performance and quality, a downtime Pareto that ranks by lost minutes, reject rate by machine and shift, plan against actual, and the refresh, publishing and handover that keep it running after you.
- 13 modules
- 8h 50m of video
- Beginner
- English
- ₹0, free
- Lab practice in your browser

₹0Free for good
Worth ₹4,999 by length and depth against classroom training. It has always been free; that is not a former price.
No card. Checkout takes a minute and gives you a receipt.
Overview
About Power BI for Manufacturing: OEE and Production Dashboards
Build a shift-wise OEE dashboard in Power BI, from downtime and production exports to a report a plant head can read.
Power BI for Manufacturing: OEE and Production Dashboards is a free, self-paced online course from EDWartens for automation engineers working with plant data. It has 13 modules and 8h 50m of video lessons by Chandoo, Learn Skills Daily, CQE Academy and others, with written notes and worked problems, a practical project with a document pack and a 15-question final assessment (pass mark 60%). Learning is free with an account; an optional certificate with a public verification code is issued when you pass. Last updated 27 September 2026.
Who it is for: Automation engineers working with plant data
This course includes
- 8h 50m of video lessons
- 13 modules with written notes and diagrams
- One final assessment: 15 questions, pass mark 60%
- Ask-an-engineer support from practising engineers
- Lifetime access, the course does not expire
- Optional verifiable certificate when you finish
- Step 1 of 3
Learn the 13 modules
8h 50m of video lessons, written notes and a practice task per module, at your own pace.
- Step 2 of 3
Pass the final assessment
15 questions drawn from every module, pass mark 60%, 3 attempts.
- Step 3 of 3
Take the certificate, if you want it
Optional, paid once, only if you choose it. The course stays free either way.
See the certificate and its price
A look inside


From the lessons
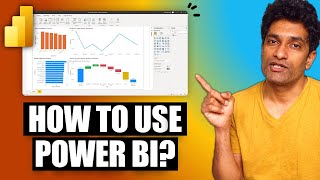
What Power BI does on an engineer's desk
by Chandoo
The same workflow, taught a second way
by Learn Skills Daily

DAX: writing the measures
by Chandoo

Report layout, tooltips and interaction
by Chandoo

Downtime Pareto and reject analysis
by Havens Consulting

Plan against actual: targets and variance
by Chandoo
Lesson frames belong to the creators named in the Credits and are shown from YouTube.
What you learn
What you will be able to do
By the end you will be able to:
- Load plant data with Power Query using steps that rerun
- Split a flat production sheet into a fact table and dimensions
- Write DAX measures for availability, performance, quality and OEE
- Build a downtime Pareto and a reject-rate view
- Set up refresh, publishing and a handover note
How it works
How this course works
Watch the lessons
Short video lessons, one module at a time, at your own pace.
Read the notes
Open the Reading tab for the written notes and diagrams of the module.
Practise in the 3D labOptional
Try the module in the free 3D lab, in your browser.
Check yourself
Answer the questions to see what stuck before you move on.
Final assessment
Pass the final once you have been through the modules.
Certificate, if you want oneOptional
Optional, with a page anyone can use to verify it.
Syllabus
Course content, module by module
In order, at whatever pace suits you. Each module ends with a practice task that builds on the last.
- Modules
- 13
- Video lessons
- 21
- Of video
- 8h 50m
- Final questions
- 15
- 01
What Power BI does on an engineer's desk
2 lessons · 24m - 02
Your first report, start to finish
1 lesson · 38m - 03
The same workflow, taught a second way
1 lesson · 36m - 04
Power Query and the star schema, with lab practice:
3 lessons · 50m - 05
DAX: writing the measures
1 lesson · 54m - 06
Choosing visuals a plant head can read
2 lessons · 38m - 07
Report layout, tooltips and interaction
2 lessons · 32m - 08
OEE: availability, performance and quality
3 lessons · 57m Final assessment · 15 questions, pass mark 60%
3D lab
Practise in the 3D lab
Practise the data half of the course in the lab: clean a messy downtime export with steps that run again next week, then rank losses and compare lines to target. You build no dashboards or DAX there.
- The downtime report: clean the export, answer in SQLAI Workbench, about 35 minOpen in the lab (opens in a new tab): The downtime report: clean the export, answer in SQL
Optional. Skip it whenever you like: it never blocks your progress or your certificate.
Project
The course project
Optional practice that ends in the kind of job the course prepares you for, with the documents that go with it.
About 16 hours
One OEE definition for three plants: a Power BI dashboard from shift logs to row-level security
Build the OEE and production dashboard for a three-plant auto-parts company. Use Power Query on each plant's shift and downtime exports, and a star schema. Build the DAX chain for availability, performance, quality and OEE. Add a downtime Pareto by lost minutes, and plan against actual. Then set up the publish, refresh and row-level security that let each plant see only itself. You deliver the .pbix, your own measure register and validation report, and the refresh procedure. The sample pack shows what each one looks like when a consultant delivers it to a plant.
- 7documents in the pack
- 9steps to follow
- 6things to hand in
- 16 hof work, at your pace
Sample document pack, 7 documents, filled in for the scenario
- URSUser Requirements: Group OEE and Production Dashboard
- SDSSoftware Design Specification: OEE Dataset and Report
- RegisterMeasure Register: DAX Definitions and Validation References
- HMI specPage Specification: Hierarchy, Visuals, Filters and Roles
- Test reportValidation Report: Load, Model, Measures Against Source, Pages, Security and Refresh
- ProcedureProcedure: Publishing, Refresh, Row-Level Security and Maintenance
- Training recordTraining Record: OEE Dashboard, Viewers, Plant Engineers and Analyst
Read inside the course and download as a workbook. The project is optional practice, marked when you submit it; the certificate needs only the modules and the final assessment.
Tools
Software, hardware and lessons
Software
Power BI Desktop, a free download from Microsoft, Windows only. Excel for the sample files. Every module can be completed on Desktop alone, without a Power BI service licence.
Hardware
A Windows PC or laptop. Nothing on the plant side.
Who it is for
Beginner. Comfort with Excel helps, no coding needed. Power BI Desktop is free but runs on Windows only.
Video lessons by
- Chandoo
- Learn Skills Daily
- CQE Academy
- PK: An Excel Expert
- Havens Consulting
Independent creators, credited in full under Credits.
Software you need
What to download, where from, what it costs and how to install it. Every link goes to the maker's own site, never a mirror.
Every module can be completed in Power BI Desktop alone, without a Power BI service licence.
Required
- 01Free
Power BI Desktop
Microsoft
- Runs on
- Windows 10, Windows 11 or Windows Server 2016 and later, 64-bit
- Account
- None needed
- Size
- about 662 MB download for the installer from the Download Center
Power BI Desktop is a free download for building data models and reports on your own PC. Sharing reports through the Power BI service needs a Power BI licence.
Steps
- 1.Open the Power BI Desktop page and select Download free.
- 2.Install it from the Microsoft Store, or download the installer from the Microsoft Download Center.
- 3.Start Power BI Desktop and close the sign-in prompt if you only work locally.
- 4.Select Get data to load the course's Excel or CSV file.
- 5.Save your report as a .pbix file.
- The Microsoft Store version updates itself and does not need administrator rights.
- On a Mac, run Windows in a virtual machine; there is no macOS version.
- At least 4 GB of RAM and a 1440x900 or larger screen are recommended.
Official download pagemicrosoft.com
Optional
Useful, not needed to finish the course.
- 02Free web version with limits
Microsoft Excel
Microsoft
- Runs on
- Excel for the web in any modern browser; desktop apps for Windows and macOS with a Microsoft 365 subscription
- Account
- A free Microsoft account
Excel for the web is free with a Microsoft account and 5 GB of cloud storage. The desktop app comes with a paid Microsoft 365 subscription, which offers a free trial. Python in Excel is not available on free licences, and fuller Copilot features need an eligible paid plan.
Steps
- 1.Open the Excel page on microsoft.com and select Sign up for free, or Sign in.
- 2.Create or sign in to your Microsoft account.
- 3.Select Open Excel to start Excel for the web.
- 4.Upload the course workbook to OneDrive and open it.
- 5.If a lesson needs a desktop-only feature, consider the Microsoft 365 free trial.
- Most formulas, tables and charts work in Excel for the web; some advanced tools, such as Power Pivot and many add-ins, need the desktop app.
- Check the Python in Excel availability page before a Python lesson.
Official download pagemicrosoft.comAlternatives
- LibreOffice Calc: Free desktop spreadsheet for Windows, macOS and Linux.
- Google Sheets: Free browser spreadsheet with a Google Account.
Checked against each maker's own page on 27 September 2026. Trial lengths and editions change; the maker's page is the final word.
What you walk away with
Your certificate for Power BI for Manufacturing: OEE and Production Dashboards
Finish the course, pass the final, and this is the document with your name on it.

Verifiable by anyone
Adds to LinkedIn in one click
QR code on the certificate
Names what you can do
A permanent link
Earned, not attended
Learning is free. The certificate is optional.
Add it now and pay only when you have finished the course, or come back for it later. One-off, US$23.99, with a receipt.
Issued by Wartens Ltd (England and Wales, company no. 15262249) through the EDWartens training portal, as a Certificate of Completion for this self-paced course. Sold in India by Wartens Automation Private Limited. It is not a vendor certification, a university award or a CPD-accredited activity, and it does not certify competence on live equipment. Delivered electronically; see the refund policy.
Practise what you learn in the free 3D lab
Technical work is judged on what you can do: wiring, commissioning, finding a fault. Doing a task yourself teaches more than watching it a second time, and a lab lets you try it safely before you meet real equipment. It does not replace working on real hardware.
- Practise safely, so a mistake costs nothing.
- The lab checks your work like a site test, so you know when it is right.
- Free, in your browser, with nothing to install.
Why learn with EDWartens
What you get with this course.
- Free from the first lesson to the final assessment.
- Practice in a free 3D lab in your browser, with nothing to install.
- Video lessons with written notes and a project.
- An optional certificate that anyone can verify online.
FAQ
Common questions
Is the Power BI for Manufacturing course really free?
Yes. All twelve modules, the practice tasks, the notes and the assessments are free. You create an account so your progress is saved and the final assessment can be marked. The certificate is the only paid item, and only if you want one.
What certificate does the Power BI for Manufacturing course give?
An EDWartens Certificate of Completion, issued when you have finished every module and passed the final at 60 percent, with a verification code anyone can check. It is not a Microsoft credential and is never described as one.
Who made the video lessons in the Power BI for Manufacturing course?
Chandoo and Learn Skills Daily, on their own YouTube channels, credited at the foot of the course page. EDWartens did not make the videos and neither creator is affiliated with EDWartens. What EDWartens wrote is the study plan, the notes, the OEE material, the practice tasks and the assessments.
Do I need to buy Power BI?
No. Power BI Desktop is a free download from Microsoft and every module can be completed on it. Note that Desktop runs on Windows only, so a Mac needs Windows in a virtual machine. Publishing and sharing through the Power BI service needs a licence, which your employer usually already holds inside its Microsoft 365 tenant.
Is this the same as the Microsoft PL-300 certification?
No. PL-300 is Microsoft's paid exam. This course is neither that exam nor a substitute for it. It is preparation and practice. It covers Power Query, modelling, DAX and report design on manufacturing data, which is the same ground. The certificate you receive is an EDWartens Certificate of Completion.
Do I need to know Python or SQL first?
No. This is the no-code route. If you can build a pivot table in Excel you have enough. The SQL and Python courses in the track sit beside this one, not before it.
What if my plant has no OEE data yet?
That is the normal starting point. The practice tasks are written for one machine and one shift on paper, so you can work through the whole course with a downtime register and a production log. The course also covers what to do when the reason codes are free text, which is the usual problem.
Who is the Power BI for Manufacturing course for?
Automation, maintenance, quality and production engineers who currently report in Excel. It is also for anyone who has been asked to put the daily production numbers on a screen. The engineer who builds the OEE dashboard tends to become the one who presents it in the morning meeting.
Do I have to use the lab?
No. The lab is optional practice. You can skip it whenever you like, and it never blocks your progress, the final assessment or your certificate.
Is the lab free?
Yes. Every lab level for this course opens in your browser, free, with nothing to install.
Is the Power BI for Manufacturing course free in India, and what does the certificate cost?
Yes. Learning costs ₹0 in India: every module, the written notes, the practice tasks and the final assessment, with no card and no trial period. The only paid item is the optional EDWartens Certificate of Completion, ₹499 including GST for this beginner course, paid in rupees through Razorpay, and only if you want it after passing the final assessment.
All course factsHide course facts
- Price
- ₹0, free for good. No trial, no card. Comparable classroom training of this length costs about ₹4,999.
- Who it is for
- Automation engineers working with plant data
- Format
- 13 self-paced modules, 8h 50m of video, written notes, a practice task per module and one final assessment.
- Level
- Beginner. Beginner. Comfort with Excel helps, no coding needed. Power BI Desktop is free but runs on Windows only.
- Brand
- Vendor-neutral
- Software
- Power BI Desktop, a free download from Microsoft, Windows only. Excel for the sample files. Every module can be completed on Desktop alone, without a Power BI service licence.
- Hardware
- A Windows PC or laptop. Nothing on the plant side.
- Certificate
- Optional EDWartens Certificate of Completion, ₹499 inclusive of GST for learners in India, verifiable by code. Not a vendor credential.
- Video lessons by
- Chandoo, Learn Skills Daily, CQE Academy, PK: An Excel Expert, Havens Consulting (independent creators, credited below)
- Language
- English
- Last updated
- 27 September 2026
Pairs well with
 PLC programming · FreeSiemens TIA Portal
 PLC programming · FreeSiemens TIA Portal in Three Hours
 PLC programming · FreeTIA Portal: Build a Machine
 Instrumentation · FreeInstrumentation for PLC Engineers
More free courses: Free Industry 4.0 and IIoT courses · Free Six Sigma and quality courses
Classroom course, Bangalore
PLC training in Bangalore
The Automation Engineer Program (AEP) is our classroom course in PLC programming and industrial automation, taught in person at our Electronic City centre.
Credits
Who made the video lessons
The video lessons in this course were created by the people below, not by EDWartens. Every lesson streams from its creator's own YouTube channel; EDWartens neither hosts nor sells that footage, and the creators are not affiliated with EDWartens and do not endorse this course. What EDWartens wrote is the study plan, the notes, the practice tasks and the assessments.
- Chandoothe getting-started and vocabulary lessons, Power Query, the star schema and data modelling, the DAX and Power Pivot examples, chart choice and the visuals masterclass, tooltip pages, and the three full dashboard builds
- Learn Skills Dailythe Power BI Full Course ladder, used as a second pass over the workflow and as the walkthrough beside the OEE, Pareto and reject-rate modules
- CQE Academya lesson in "OEE: availability, performance and quality"
- PK: An Excel Experta lesson in "OEE: availability, performance and quality"
- Havens Consultinga lesson in "Downtime Pareto and reject analysis"
If you are one of these creators and would like a lesson removed or credited differently, write to info@wartens.com.